Fig. 1.

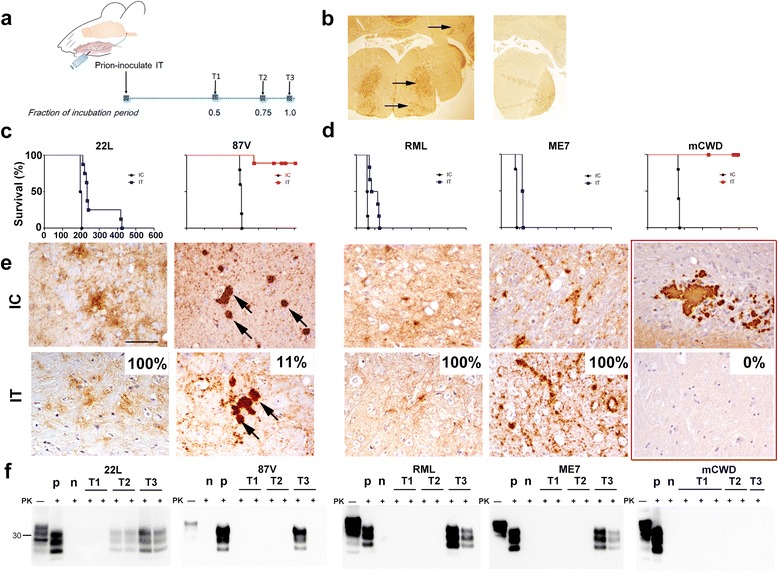
Fibrillar prion strains rarely neuroinvade following intra-tongue inoculation. a Schematic of time course experiment following IT exposure. T1, and T2: 0.50 and 0.75 of the expected incubation period; T3: terminal disease (1.0). b Paraffin-embedded tissue (PET) blot of brainstem (T2 timepoint) shows subfibrillar prions in the facial, reticular, and deep cerebellar nuclei (strain RML, left panel, arrows), whereas fibrillar prions were not detected at any early timepoint (strain 87V, right panel). c Survival curves of WT or d tga20 mice (overexpress mouse PrPC) inoculated IT or IC with subfibrillar (blue - 22L, RML, ME7) or fibrillar (red - 87V, mCWD) prion strains. e Brain immunolabelled for PrP shows diffuse prion aggregates or large dense plaques in mice exposed to highly or poorly neuroinvasive prions, respectively. No plaques were detected in mice inoculated with mCWD IT (red box highlights brain sections from mice inoculated with mCWD by the IC versus IT route). Percentage of IT-inoculated mice that developed terminal prion disease is noted. Brain regions shown are as follows: cerebral cortex (IC: 22L); corpus callosum (IC: mCWD); thalamus (IC: 87V, RML, ME7; IT: 22L); hypothalamus (IT: ME7); brainstem (IT: 87V, RML, mCWD). f Immunoblots of brain from T1, T2, and T3 timepoints post IT inoculation. “p” and “n” refer to prion positive and negative brain samples (controls), and PK indicates proteinase K treatment. For IC inoculated mice, n = 4 (22L), 5 (87V, ME7, mCWD), or 6 (RML). For IT inoculated mice, n = 8 (22L), 9 (87V), 6 (RML), 4 (ME7), or 5 (mCWD). Scale bar = 100 μm
