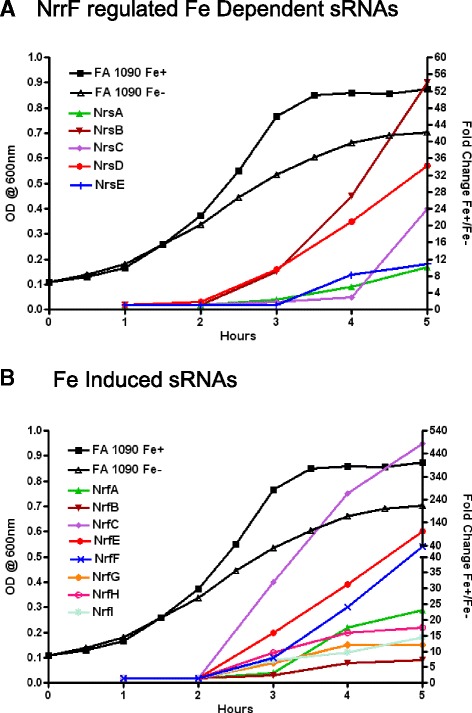
Fig. 6.

Temporal control of Fe regulated sRNAs. Real time PCR fold change results for all Fe-induced sRNAs were plotted against a representative example of an FA 1090 growth curve showing O.D. values across the 5 h time point to demonstrate the temporal increases in Nrs sRNA a) and Nrf sRNAs b). NrfD is not presented here as this sRNA was Fe-repressed and did not demonstrate temporal control
