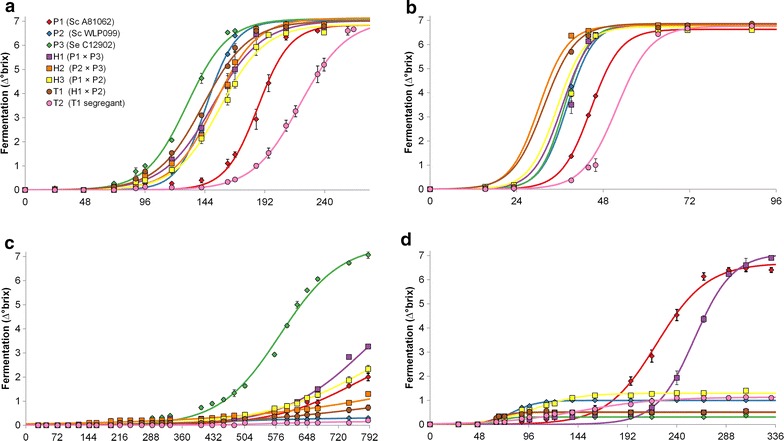
Fig. 2.

Fermentation profiles (decrease of °Brix over time as hours) of the 8 brewing strains in the growth assays performed at a 10 °C with no supplemented ethanol, b 20 °C with no supplemented ethanol, c 10 °C with 8% (v/v) supplemented ethanol, and d 20 °C with 8% (v/v) supplemented ethanol. Points represent means of measured values, with error bars showing the standard deviation of three replicate cultivations. The growth curves were modelled using the logistic model in the ‘grofit’ package for R [60]
