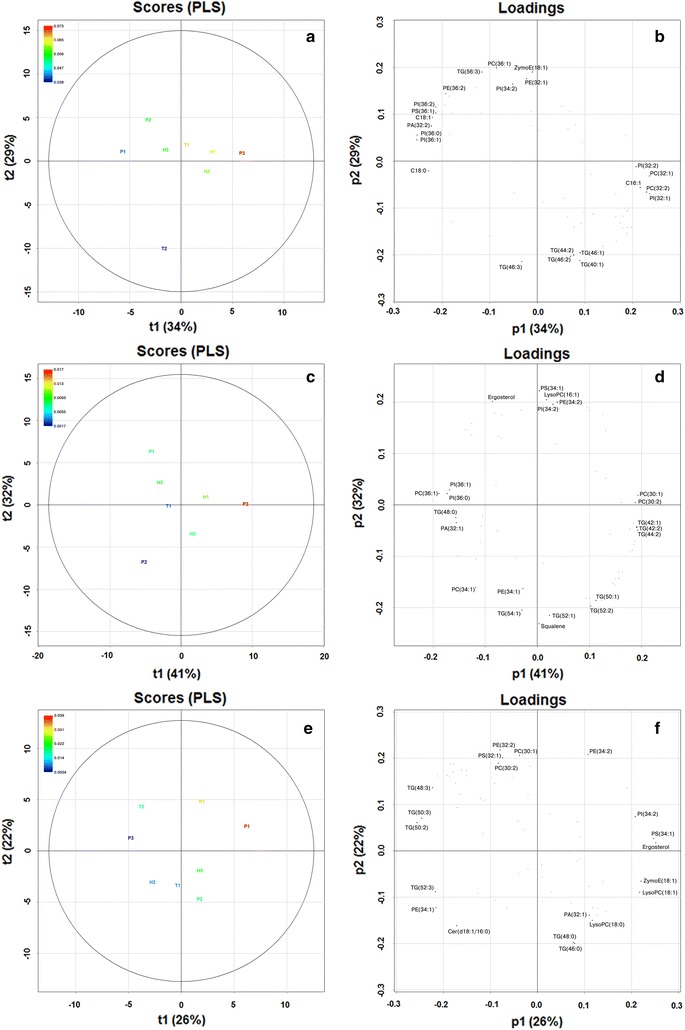
Fig. 6.

Score and loading plots of the PLS models built from the fermentation and lipid data obtained at different temperatures and supplemented ethanol levels (a, b 10 °C, 0% EtOH; c, d 10 °C, 8% EtOH; e, f 20 °C, 8% EtOH). The Y variable of the models was the maximum fermentation level divided by the lag time (A and λ from Table 2, respectively), while the X variables were the combined dataset of the compositions of fatty acids, squalene and ergosterol obtained from GC/MS analysis and the compositions of the 60 lipid species obtained from UPLC/MS lipidomics analysis. Model properties: a, b R 2 = 0.95, Q 2 = 0.76 (p < 0.05 by random permutation test), and model uses 2 components; c, d R 2 = 0.87, Q 2 = 0.49 (p < 0.05 by random permutation test), and model uses 2 components; e, f R 2 = 0.97, Q 2 = 0.51 (p < 0.05 by random permutation test), and model uses 2 components
