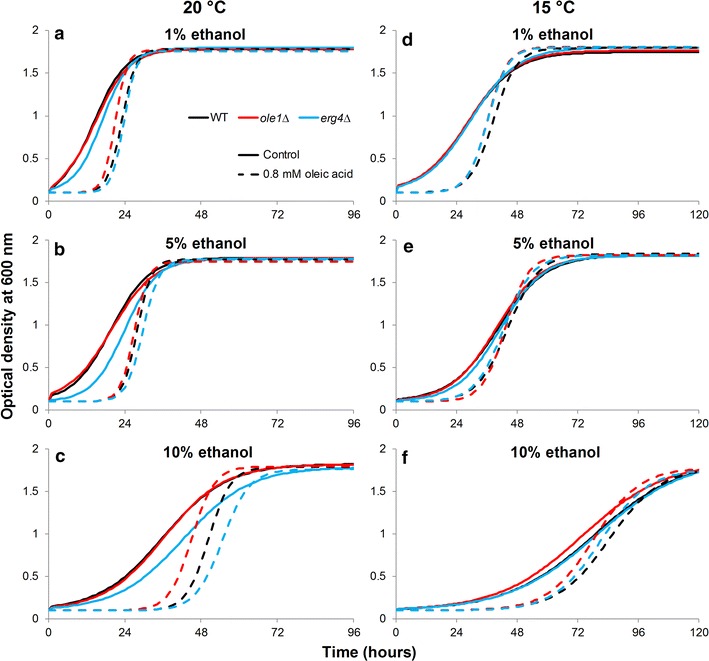
Fig. 7.

The growth curves (OD600) of the three laboratory strains grown in media supplemented with 0.8 mM oleic acid (dashed line) and a, d 1%, b, e 5%, or c, f 10% ethanol. Cultivations were performed in microplate format at 20 °C (a–c) and 15 °C (d–f). The growth curves were modelled using the logistic model in the ‘grofit’ package for R [60] based on data obtained from four biological replicates during microplate cultivations. Model parameters are presented in Additional file 1: Table S2
