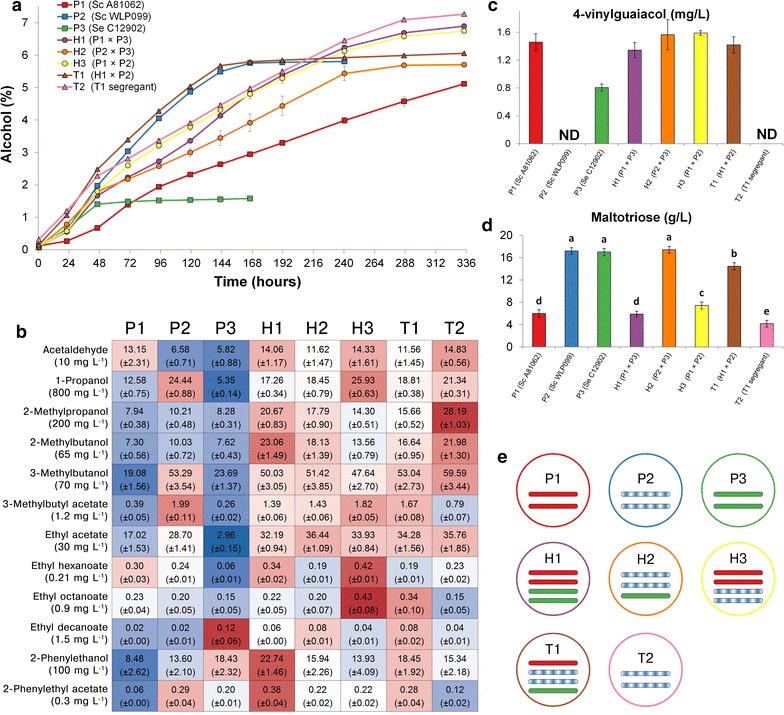
Fig. 8.

The a alcohol content (% ABV), b higher alcohol and ester concentrations (mg L−1), c 4-vinyl guaiacol concentration (mg L−1), and d maltotriose concentration (g L−1) in the beers fermented from the 15 °P wort with the 8 brewing strains. a, c, d Values are means from two independent fermentations and error bars where visible represent the standard deviation. Maltotriose concentrations with different superscript letters (a–e) differ significantly (p < 0.05). ND not detected. b The heat map was generated based on z-scores (blue and red indicate low and high values, respectively). The values in parentheses under the compound names represent the flavor threshold [65, 66]. Values are means from two independent fermentations (standard deviation in parentheses) and they have not been normalized to the ethanol concentration. e The PAD1 alleles detected in the whole genome sequences of the 8 brewing strains. The alleles from the parent strains P1, P2 and P3 are depicted in red, blue and green bars respectively. A striped bar (P2) depicts a sequence containing single nucleotide polymorphisms (SNPs) possibly resulting in loss-of-function. The SNPs that were detected in the sequences of PAD1 and FDC1 are presented in Additional file 1: Table S3
