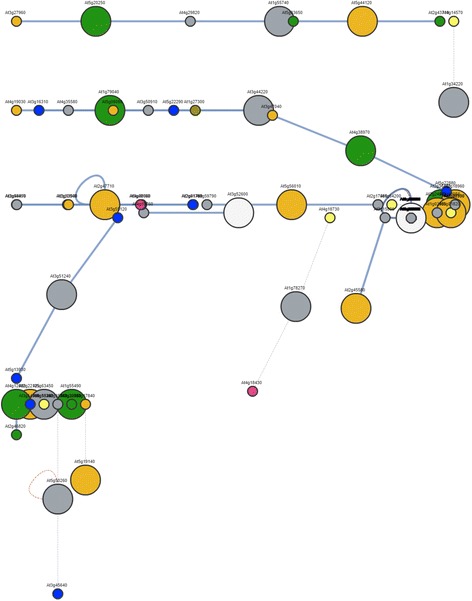
Fig. 7.

Graphical representation of candidate protein-protein interaction networks involved in apomictic reproduction. Networks were generated with the BAR Arabidopsis interaction viewer (Geisler-Lee et al. 2007), by loading the putative Arabidopsis orthologs of the 200 top ranked candidates differentially expressed between the sexual and apomictic 454 libraries. Nodes represent proteins with the following localizations: green: chloroplast; pink: cytoplasm; yellow: vacuole; orange: plasma membrane; blue: nucleus; grey: unknown. Edges indicate the interactions. Light blue bold lines mark the experimentally determined interactions
