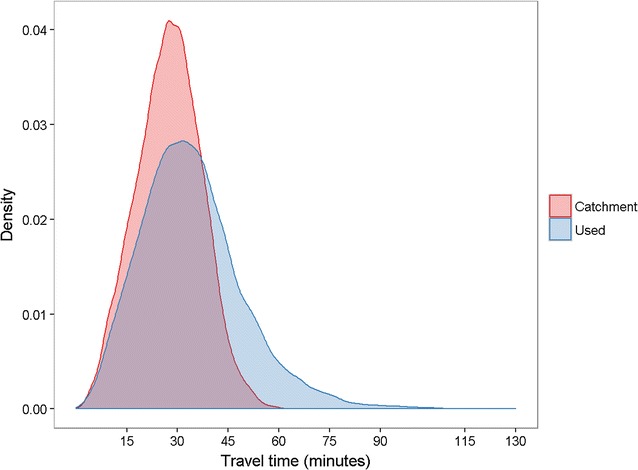
Fig. 3.

Distribution of estimated travel times for tuberculosis patients to used and catchment clinics, London, 2010–2013. N = 12,061 patients; catchment clinic defined for each patient as the clinic that would provide the shortest travel time. Density function generated using standard Gaussian kernel density estimator
