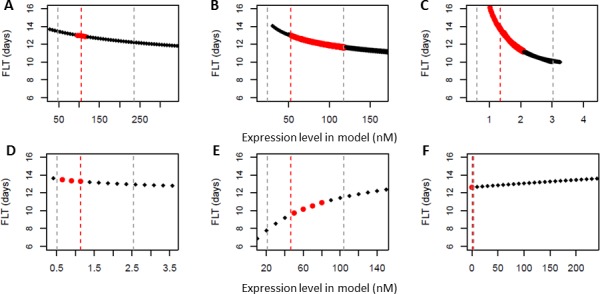
Figure 1. Dynamic model predicts linear dependency of flowering time in different genetic backgrounds on floral pathway integrator gene expression levels.

The dynamic Ordinary Differential Equation (ODE) model for flowering time regulation in Leal Valentim et al. (2015) was used to simulate how flowering time (FLT) depends on gene expression level measured at day 10 for (A) AGL24 (B) SOC1 (C) LFY (D) FT (E) SVP (F) FLC. To mimic genetic variation in upstream signalling pathways, parameter values in the ODE model were modified as explained in Methods. Red points indicate the expression level of the gene at day 9–11 in the unperturbed model. Vertical dotted grey lines indicate five-fold expression range around the expression level at day 10 in the unperturbed model, which is indicated with a vertical dotted red line. For FLC, the five-fold range is small compared to the displayed range and the vertical lines fall on top of each other.
