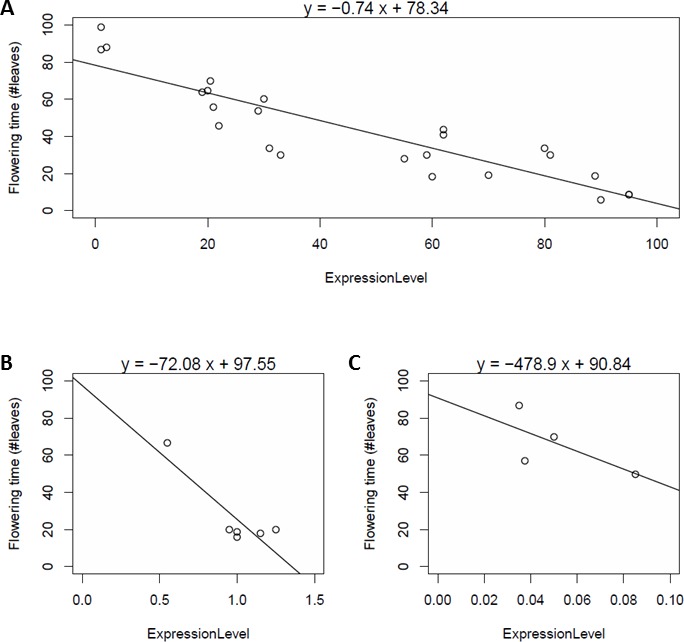
Figure 2. Dependency of flowering time (vertical axis) on SOC1 expression levels (horizontal axis) in various genetic backgrounds and various conditions, obtained in three different studies (A–C).

Flowering time is reported in number of leaves; expression is normalized by scaling to wildtype expression level (A), normalized to actin (B) or normalized to tubulin (C).
