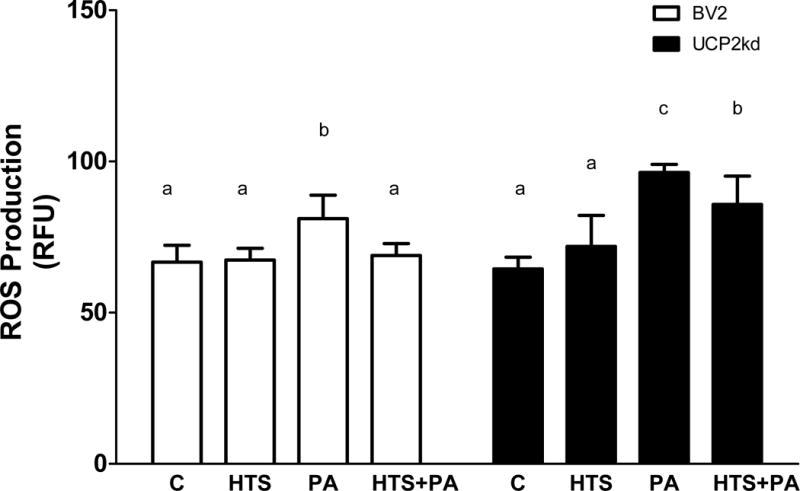
Figure 6. UCP2 effect on ROS production in microglia.

BV2 cells exposed to PA significantly increases ROS production (p<0.0001 PA vs. C), however treatment with HTS01037 attenuates PA induced ROS production (p<0.001 vs. HTS and HTS+PA). In UCP2kd cells, PA increases ROS in the presence or absence of HTS01037 (p<0.0001 PA vs. C, p<0.001 HTS+PA vs. C). Letters indicate significant differences between treatment groups.
