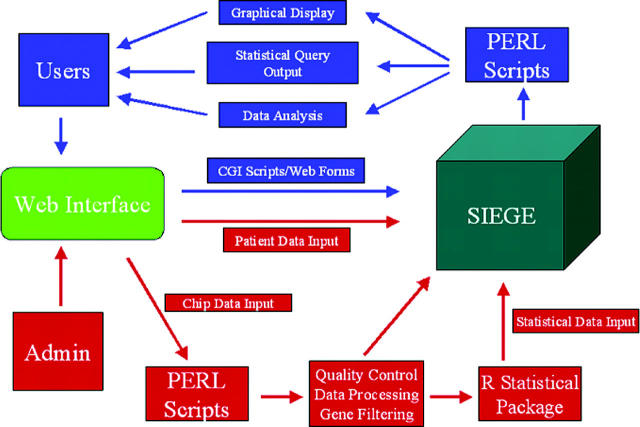
Figure 1.
SIEGE Database workflow chart. This figure displays the flow of information processing that occurs when either Users or Administrators of the site access SIEGE through the web Interface. Red arrows indicate processing steps for administrative functions and blue arrows indicate steps in returning results to users.

