
Figure 2.
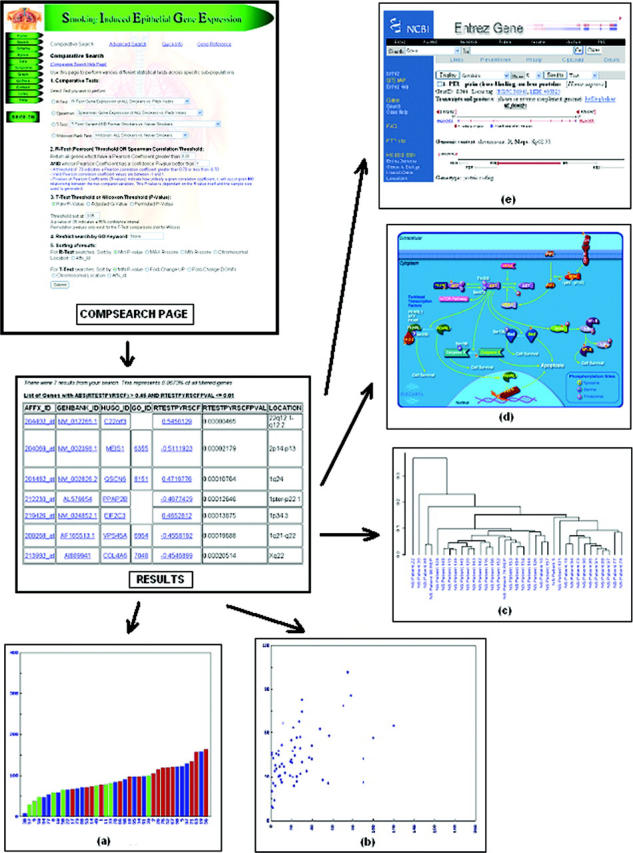
Comparative search function options. Statistical query results obtained by using the Compsearch section of the database website can be linked directly to (a) expression bar graph for given gene, with expression level on the y-axis and Patient ID number on the x-axis. Subjects are color coded for smoking status (blue, never-smokers; green, former-smokers; and red, current-smokers); (b) scatter plot for correlation analysis, with expression level on one axis and the associated continuous variable on the other; (c) hierarchical cluster of never-smoker samples based on Pearson correlation of expression levels of a set of genes; (d) Biocarta Pathway diagram for a given gene; and (e) Entrez Gene entry for a given gene.