
Figure 3.
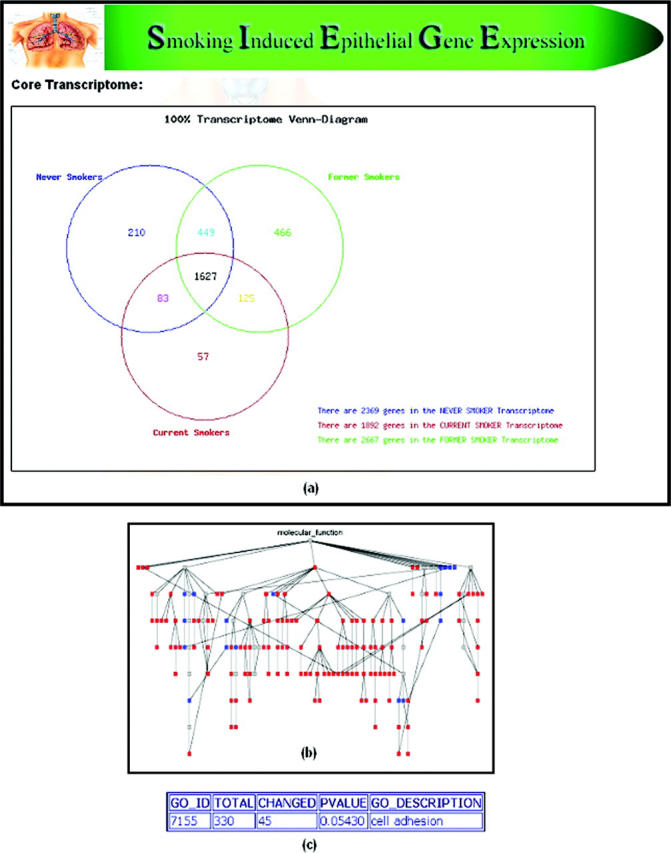
Transcriptome analysis: (a) Venn diagram of 100% transcriptome displaying number of genes in each smoker class transcriptome. (b) DAG of molecular function GO categories represented in 100% transcriptome. (c) Statistical P-value of over- or under-representation of a given GO category in 100% transcriptome.