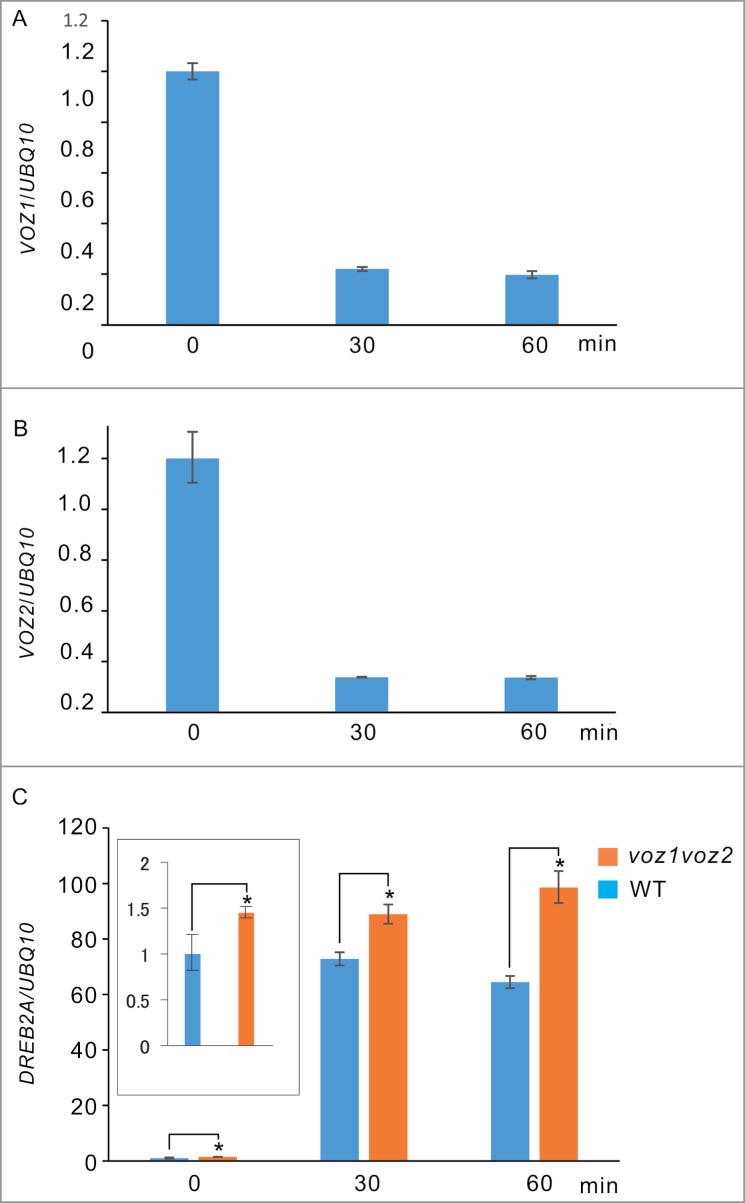
Figure 5.
Relative expression levels of the VOZ1, VOZ2, and DREB2A genes in the root under heat stress. The gene expression levels were analyzed by quantitative reverse transcription polymerase chain reaction (qRT-PCR). Seven-day-old seedlings were incubated at 42 °C at 3 time points (0, 30, and 60 min). The expression levels of VOZ1 (A) and VOZ2 (B) in the WT are presented as the values relative to the data at 0 min. (C) DREB2A gene expression levels in WT are presented as a value relative to the data at 0 min. UBQ10 served as the internal expression control. Data are represented as a mean ± standard error (SE) from 3 replications. Significant differences are indicated by asterisks above the bars (t-test; P < 0.05). The experiments were repeated 3 times and yielded similar results. Inset; the expression profile of DREB2A at 0 min in the high temperature condition.

