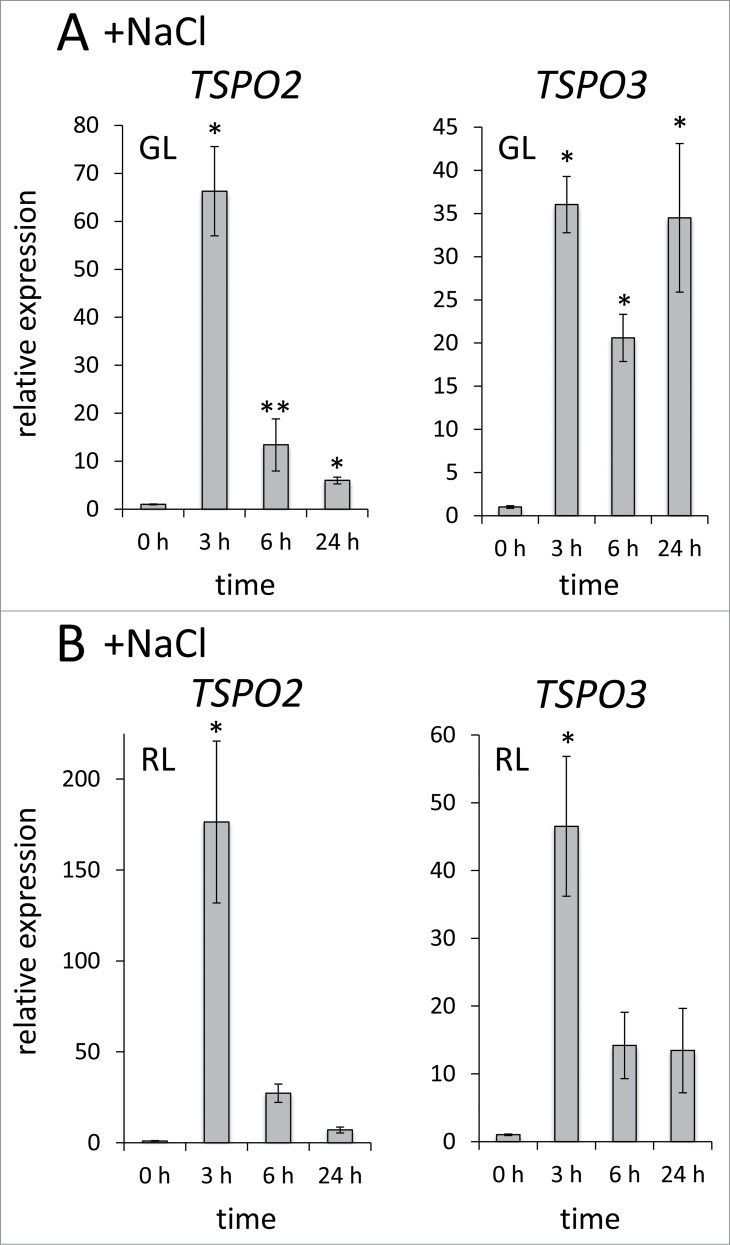
Figure 2.
Salt-dependent regulation of FdTSPO2 and FdTSPO3 transcript levels. Samples for quantitative real-time reverse transcription PCR (qRT-PCR) were taken before (0 h) and after (3 h, 6 h, 24 h) addition of 200 mM NaCl (w/v) in either (A) green light (GL) or (B) red light (RL) from wild-type F. diplosiphon cells adapted to the respective light color to assess FdTSPO2 and FdTSPO3 transcript accumulation in response to salt stress. Relative expression level compared with ORF10B gene is shown as average values ( ± SD, n = 3). Expression of FdTSPO2 or FdTSPO3 is shown relative to expression levels in WT cells at time 0 h in the respective light condition. Asterisk indicates a significant difference (*p < 0.01, **p < 0.05) between expression level at 0 h relative to each time point, as determined by ANOVA and Tukey test.

