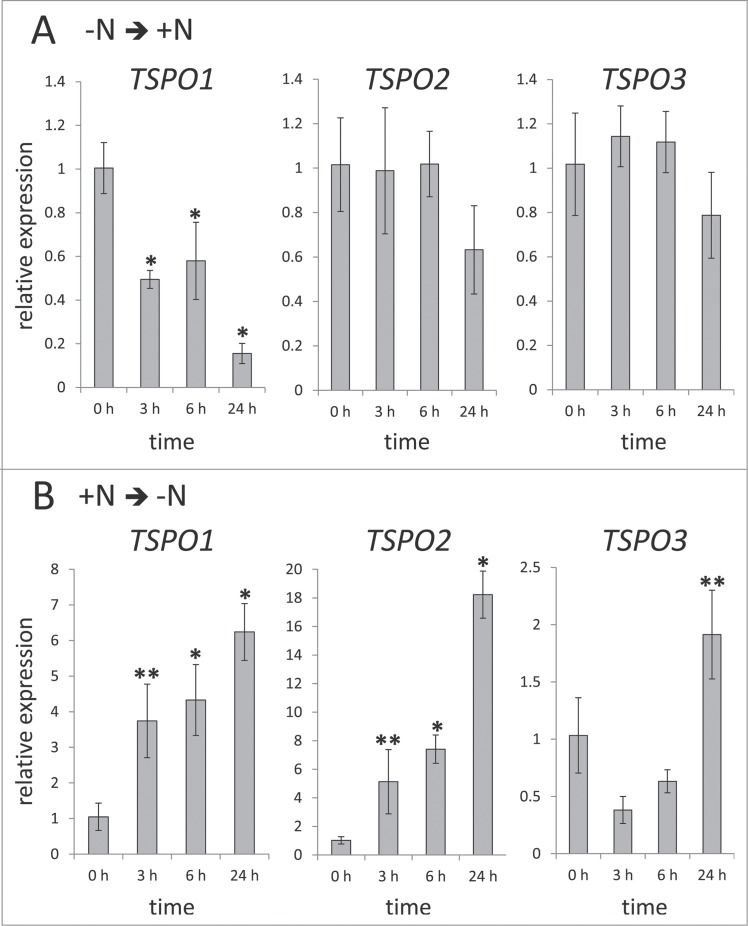
Figure 5.
Nitrogen-dependent regulation of FdTSPO transcript levels. Samples for quantitative real-time reverse transcription PCR (qRT-PCR) were taken before (0 h) and after (3 h, 6 h, or 24 h) exposing white light (WL) grown cells acclimated to either (A) nitrogen-limited (-N) conditions to nitrogen-replete (+N) medium [-N ➔ +N] or (B) grown under nitrogen-replete conditions and transferred to medium lacking added nitrogen [+N ➔ -N]. The relative expression level compared with ORF10B gene is shown as average values ( ± SD, n = 3). Expression of each FdTSPO is shown relative to expression levels in wild-type F. diplosiphon cells at time 0 h before changing nitrogen availability. Asterisks indicate a significant difference (*p < 0.01, **p < 0.05) between expression level at 0 h relative to each time point before the growth medium exchange, as determined by ANOVA and Tukey test.

