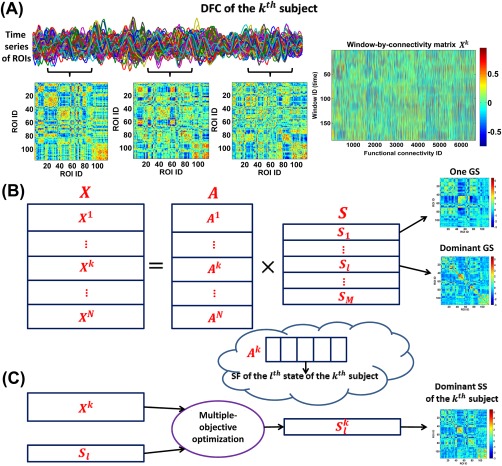
Figure 1.

Framework for the DFC analyses. (A) Estimation of dynamic connectivity using a sliding time window method. (B) The first step of GIG‐ICA. For each group, the window‐direction concatenated dynamic connectivity of all subjects was decomposed by one ICA to obtain the GSs and the associated SFs. (C) The second step of GIG‐ICA. Based on the dominant GS and the individual‐subject dynamic connectivity, we used a multiple‐objective optimization to estimate the dominant SS for each subject. [Color figure can be viewed at http://wileyonlinelibrary.com]
