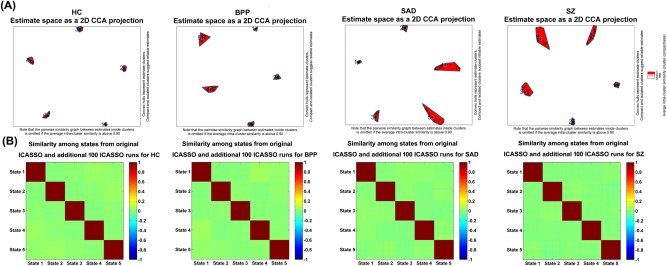
Figure 3.

Reliability of GSs obtained from ICASSO runs. (A) ICASSO results of the group‐level states. Clusters are indicated by red convex hulls and white/red lines connect similar estimates. The cyanic circles indicate the reliable GSs, which were used for consequent analyses. (B) Similarity matrix among the states from original and additional 100 ICASSO runs. Each similarity matrix was computed based on 5 × 101 states obtained from original and additional 100 ICASSO runs. Each block on the diagonal of one similarity matrix reflects the similarity among corresponding states computed from 101 ICASSO runs. [Color figure can be viewed at http://wileyonlinelibrary.com]
