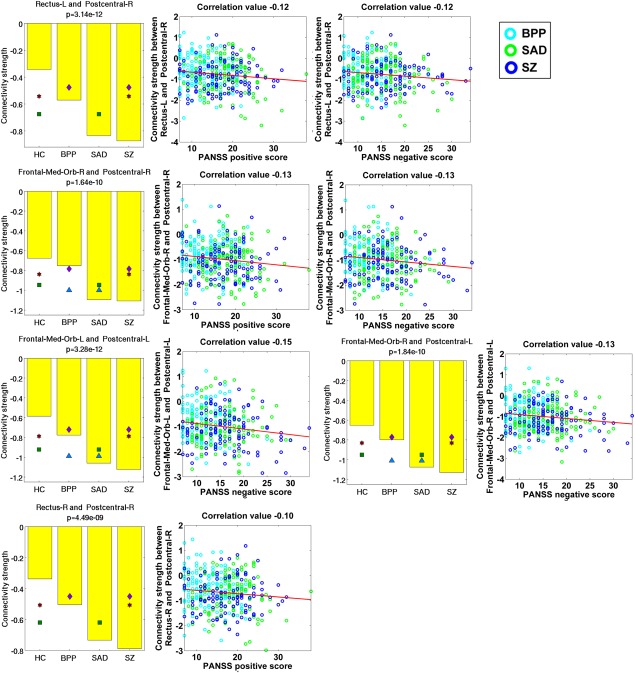
Figure 9.

Statistical analyses and symptom association results of five hypoconnectivities that had significant correlations with the symptom scores. Statistical analyses result of each FC linking two ROIs is shown using a subfigure, where each bar shows the mean of connectivity strengths across subjects in one group, and the title includes the P‐value of ANCOVA. Any pair of groups with significant difference (two‐sample t‐test, P < 0.01 with Bonferroni correction) is denoted using two symbols with the same color and shape. Significant association was identified by computing Pearson correlation between the strengths of each discriminative FC and the symptom scores of patients (P < 0.05 with Bonferroni correction). The following similar figures are shown using the same manner. [Color figure can be viewed at http://wileyonlinelibrary.com]
