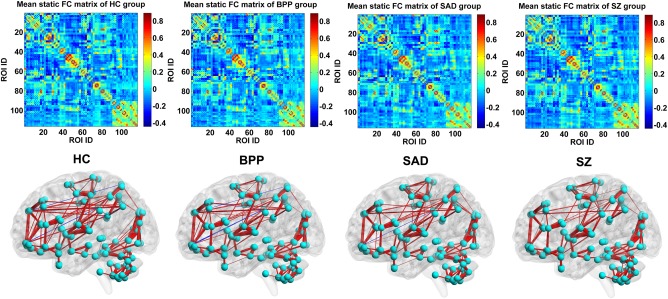
Figure 14.

The mean static FC matrix across subjects and its visualized pattern for HC, BPP, SAD, and SZ group, respectively. The red and blue lines represent positive and negative connectivity strengths, respectively. [Color figure can be viewed at http://wileyonlinelibrary.com]
