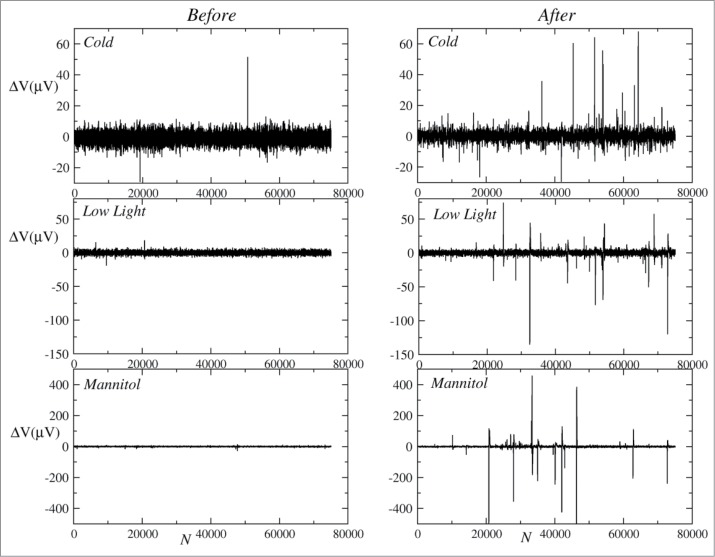
Figure 1.
Representative original data of the ΔV (low voltage variation) time series before and after environment stimuli of the 3 treatments (cold, low light, osmotic stress by mannitol). To allow easier visual comparison before and after stimuli, the scale of y axes were adjusted to each treatment. N is the length of time series in arbitrary units. Sampling rate was f = 125 Hz thus, to convert x axes to seconds, divide N by f.

