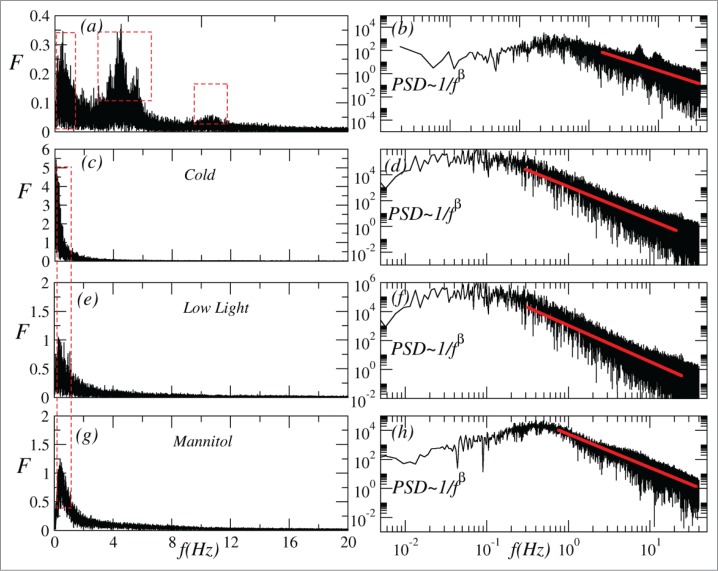
Figure 2.
Representative spectrum analysis performed by fast Fourier transform (FFT) of time series recorded before (a) and after environmental stimuli (c) cold, (e) low light, (g) mannitol; and power spectrum density function (PSD) of time series before (b) and after environmental stimuli (d) cold, (f) low light, (h) mannitol. The doted red lines in the graphs a, c, e and g highlights the main frequencies observed in each treatment (fundamental frequencies between 0.5 and 1.5 Hz and, only in the runs before stimuli, medium frequencies around 4 Hz, and higher frequencies around 9 Hz). In the graphs b, d, f and h the β exponents were (n = 20): under cold conditions β = 2.85 ± 0.69, under low light β = 1.96 ± 0.30, and β = 2.58 ± 0.34 under osmotic stress; before stimuli β = 1.51 ± 0.21.

