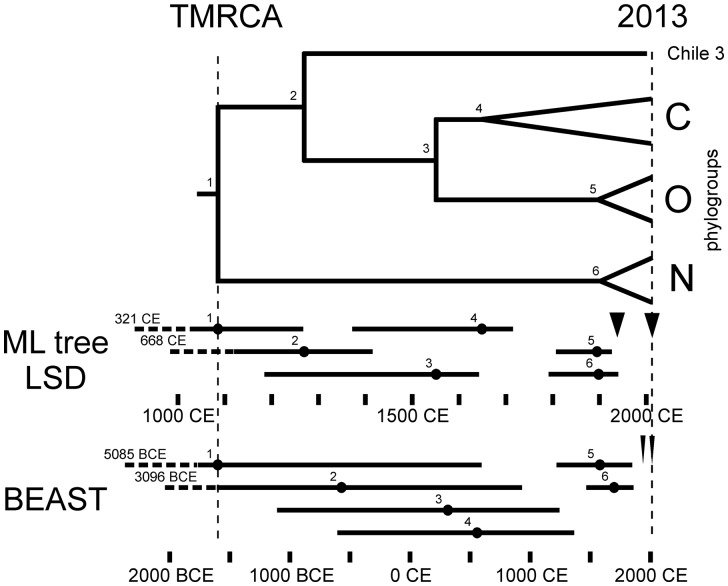
Figure 4.
A cartoon summarizing the divergence dates of a ML phylogeny of seventy-three dated n-rec ORF sequences (Table 1 - line 1) estimated by the LSD method, and the dates from the MCC tree of a BEAST analysis of the same data. Bars indicate the 95% CI ranges for both analyses. Arrows indicate the period, 1935 CE–2016 CE, during which the isolates were collected.

