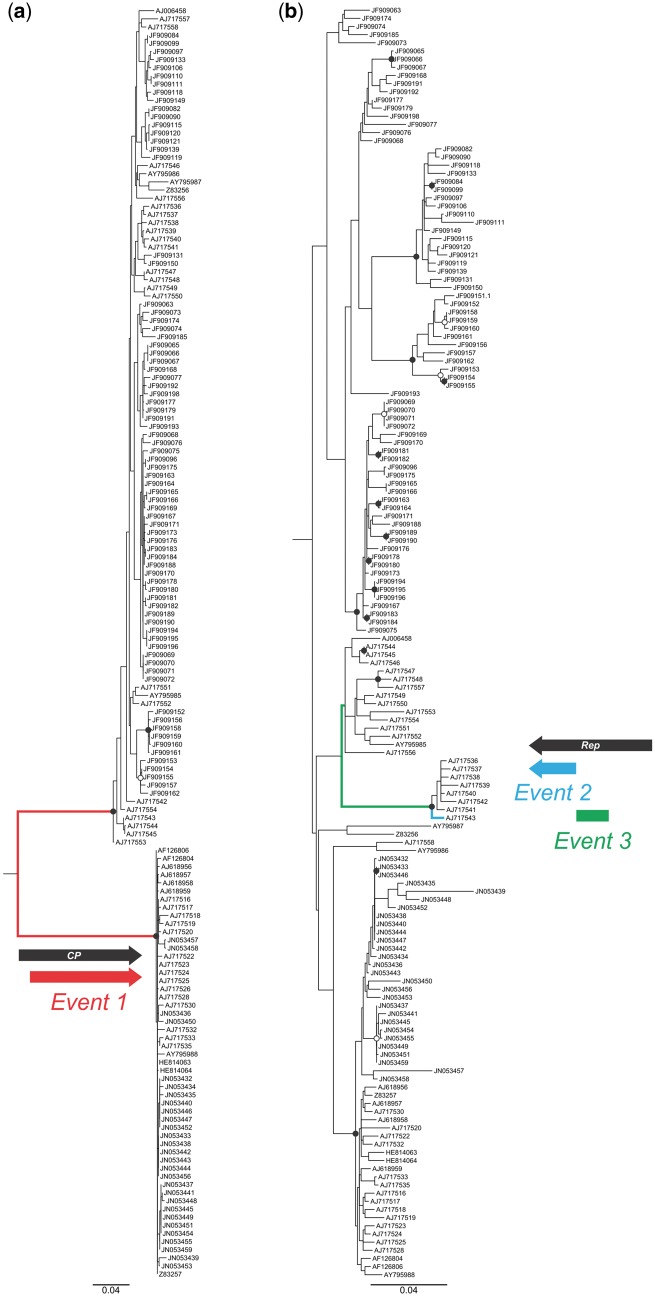
Figure 5.
Midpoint-rooted maximum likelihood trees based on the EACMV cp (a) and rep (b) gene nucleotide sequences. Nodes to the right of branches with bootstrap support ≥90% are indicated by filled circles, and those with support between 70% and 89% by empty circles. The unique recombination events detected within the cp (event 1) and rep sequences (events 2 and 3) are shown as diagrams close to the branches where the substitutions due to each recombination event were mapped. Branches in red, blue and green colors were assigned to events 1, 2 and 3, respectively.

