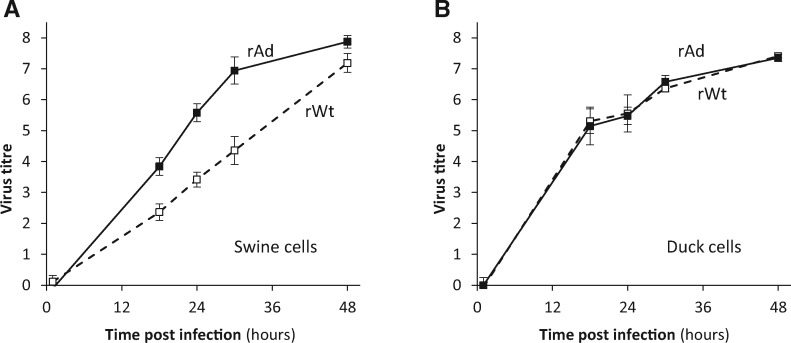
Figure 2.
Comparison of the growth kinetics of virus rWt (open squares and dashed line) and rAd (filled squares and solid line) in swine (NPTr) and duck (DEF) cells. Virus titres are expressed as log(viral copies/µl supernatant). Shown at each time point is the mean±SD from three replicate infections.

