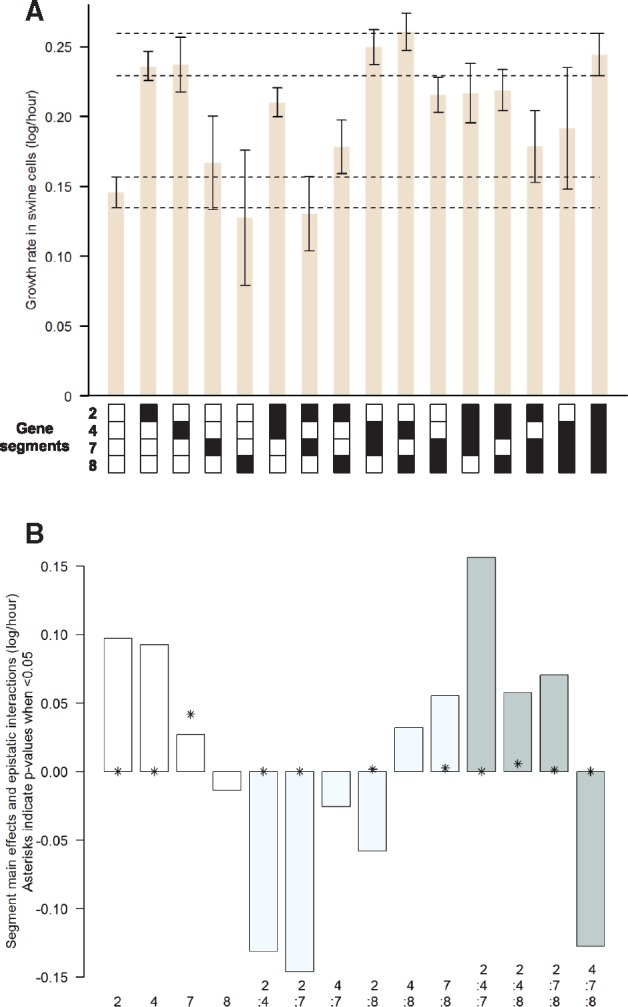
Figure 3.

Fitness of reassortants and estimates of segment main effects and interactions in swine cells. (A) Estimated growth rate of all reassortant viruses in swine cells. The genetic makeup of the rescued viruses is represented below the histograms: the respective origin of segments 2, 4, 7, 8 is shown from top to bottom with white squares indicating segments from virus rWt and black squares indicating segments from virus rAd (i.e. mutated segments). Error bars show 95% confidence intervals derived from linear growth models. Dotted lines show the upper and lower limits of the 95% confidence intervals of viruses rWt (parental) and rAd (adapted). (B) Output from the minimal adequate linear model of growth rate as a function of the four segments, showing estimates of main effects (white bars) as well as two-way (light blue bars) and three-way (grey bars) interactions. For the statistically significant effects, asterisks indicate the P values (thus an asterisk closer to zero means a more significant effect). Raw data from the virus growth experiments are available as Supplementary File S1.
