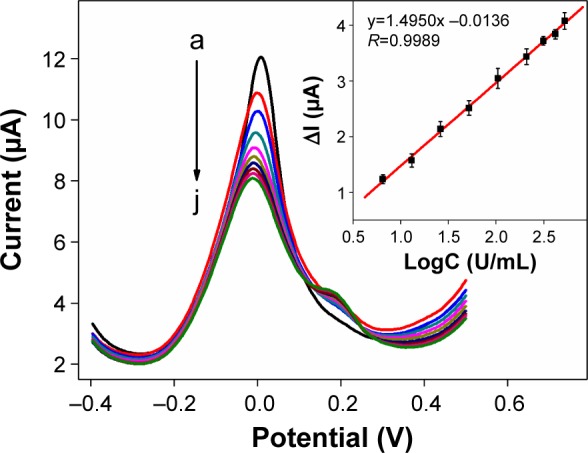
Figure 7.

DPV responses to different concentrations of CA19-9 (from a to j: 0, 6.5, 13, 26, 52, 104, 208, 312, 416, and 520 U/mL) in the PBS.
Notes: The inset shows the linear relationship between ΔI and the logarithm of CA19-9 concentrations. The error bars represent the SDs from three independent detections.
Abbreviations: DPV, differential pulse voltammetry; CA19-9, carbohydrate antigen 19-9; PBS, phosphate-buffered saline; SD, standard deviation.
