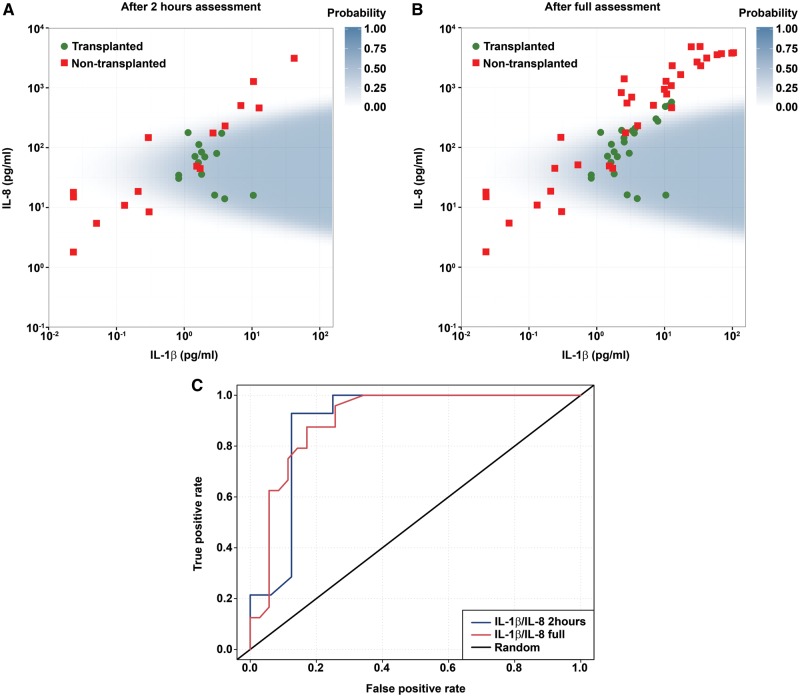
Figure 5:
(A) Early IL-1β-IL-8 signature in EVLP perfusate after 2 h of perfusion. (B) IL-1β-IL-8 signature in EVLP perfusate after full assessment. (C) ROC curve. (A) and (B) Scatter plots of IL-1β and IL-8 levels in perfusate samples from transplanted and non-transplanted EVLP donor lungs. The shaded area is the prediction region from the optimal logistic regression model with covariates IL-1β, IL-8 and (IL-8)2. (C) Receiver operating characteristic (ROC) curve of the model as a predictor of EVLP outcome. Calculated sensitivity (y axis) is plotted against the 1-specificity formula (x axis) of the logistic regression function 2 h into perfusion and after full assessment.
EVLP: ex vivo lung perfusion; IL: interleukin.

