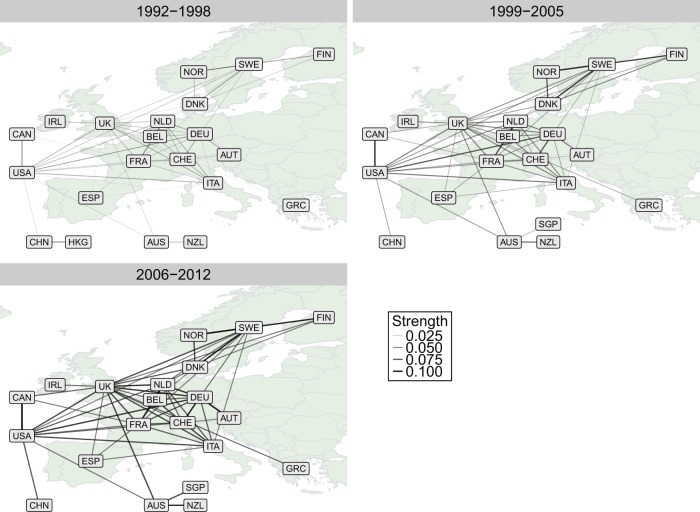
Figure 5.
Strength of collaborations between countries. The increased width and colour of the line represent stronger collaboration (see Methods). Only strong collaborations are presented, i.e. where the strength of collaboration was at least 0.05 in one time period between country pairs. (Data sourced from Thomson Reuters Web of Science Core Collection.)

