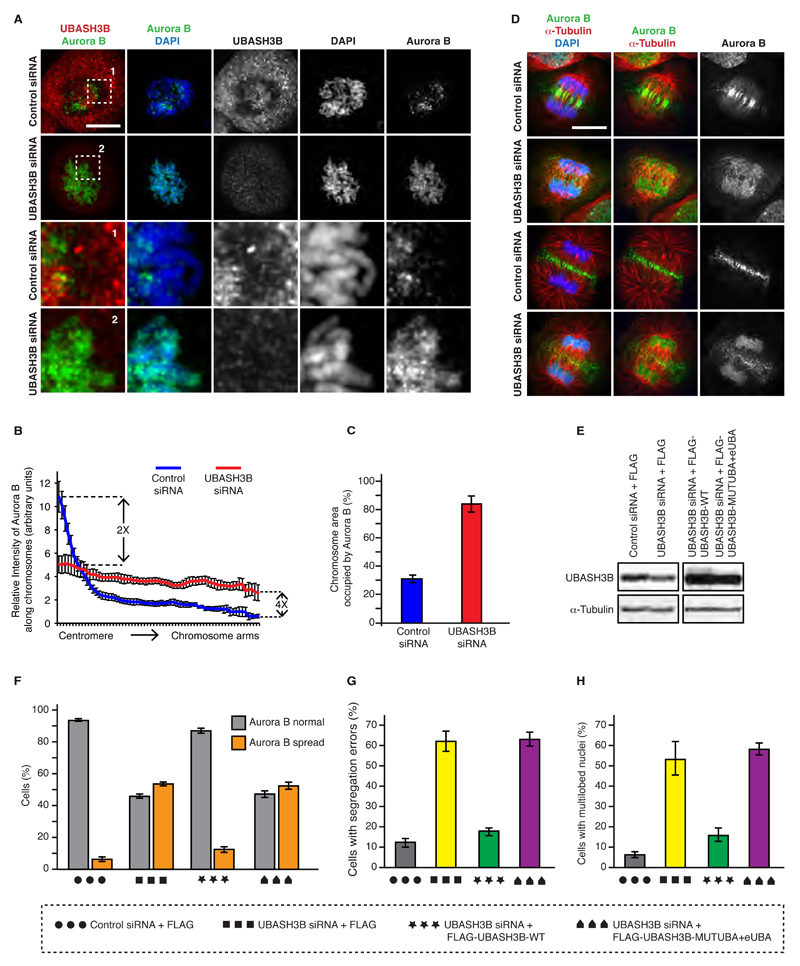
Figure 3. UBASH3B is required for Aurora B localization in mitosis.
(A) HeLa cells were treated with control and UBASH3B siRNAs, synchronized by double thymidine block and release in prometaphase and analyzed by immunofluorescence microscopy (IF). The magnified framed regions are shown in the corresponding panels below. Hereafter, scale bar is 5 μm. (B) Relative intensity ratios of Aurora B: DAPI along the individual chromosomes from centromeres to chromosome arms in cells shown in (A), n=220. (C) Chromosome area occupied by Aurora B in prometaphase cells shown in (A). (D) HeLa cells treated as in (A) were synchronized by double thymidine block and release in anaphase and analyzed by IF. Early (upper two rows) and late (lower two rows) anaphase cells are depicted. (E) HeLa cells treated with control and UBASH3B siRNAs, were synchronized by STLC treatment in prometaphase and analyzed by Western blotting. The siRNA-treated cells were simultaneously transfected with cDNAs encoding for FLAG, FLAG-WT-UBASH3B and the mutated form of UBASH3B with the UBA and eUBA domain (MUTUBA+eUBA). (F) Percentage of mitotic cells, shown in (E) (n= 1971 total) with Aurora B spread along the entire chromosomes (Aurora B spread, orange bars) or Aurora B concentrated in the centromeric regions (Aurora B normal, grey bars). (G) HeLa cells expressing H2B-mCherry and EGFP-Tubulin treated as in (E and F) were synchronized by double thymidine block and release and analyzed by live-cell microscopy. Percentage of anaphase cells with segregation errors was quantified, n=243. (H) HeLa cells treated as in (E and F) were analyzed by IF and the percentage of cells with multilobed nuclei was quantified (n=2000). All the data are shown as the mean of three independent experiments ± standard error of the mean (S.E.M.).

