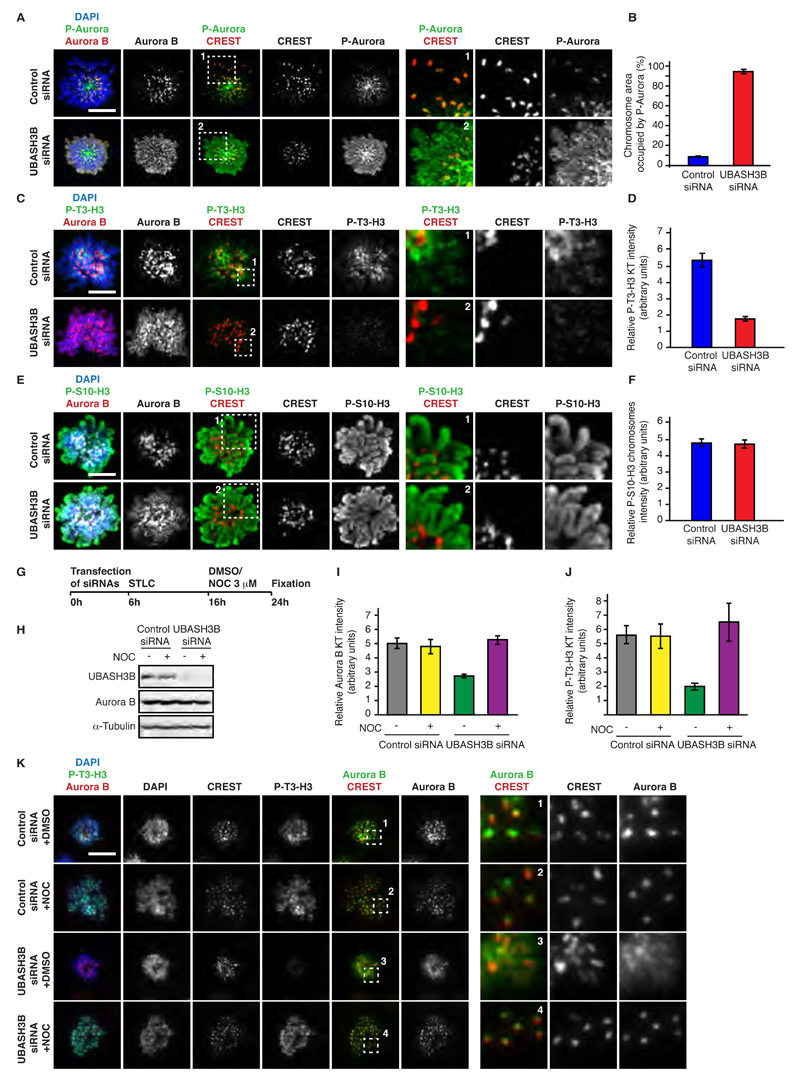
Figure 4. UBASH3B regulates Aurora B-depedent centromeric pathways on mitotic chromosomes in microtubule-dependent manner.
(A to F) HeLa cells were treated with control and UBASH3B siRNAs, synchronized in prometaphase using STLC and analyzed by immunofluorescence microscopy (IF). Hereafter, scale bar is 5 μm. (A, C and E) The framed regions are magnified and shown in the corresponding right panels. (B, D and F) Quantification of the relative intensity ratios of P-Aurora B: DAPI on the entire chromosomal area (B, n=270), Phospho-Threonine 3 histone H3 (P-T3-H3) : CREST (D, n=210) and Phospho-Serine 10 histone H3 (P-S10-H3) : DAPI on the entire chromosomal area (F, n=200). Blue bars represent control siRNAs, and red bars - UBASH3B siRNAs, respectively. (G to K) HeLa cells were treated with control and UBASH3B siRNAs, synchronized in prometaphase using STLC, treated with nocodazole or DMSO and analyzed by IF (I to K) and Western blotting (H). The scheme of the experiment is shown in (G). The quantifications of relative Aurora B and P-T3-H3 intensities on kinetochores are shown in (I) and (J), respectively. The framed regions in (K) are magnified and shown in the corresponding right panels. All the data are shown as the mean of three independent experiments ± standard error of the mean (S.E.M.).

