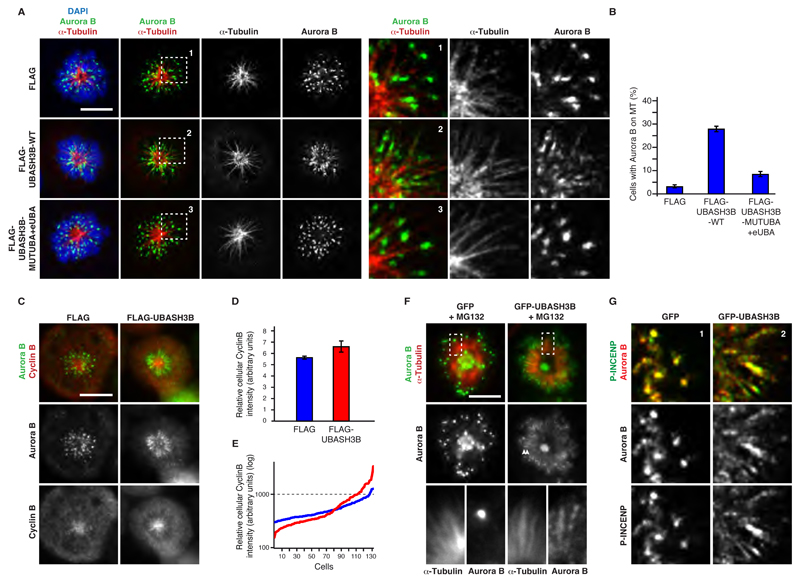
Figure 5. Overexpression of UBASH3B is sufficient to localize Aurora B to microtubules.
(A and B) HeLa cells were transfected with FLAG, FLAG-WT-UBASH3B or FLAG-MUTUBA+eUBA cDNAs, synchronized in prometaphase using STLC and analyzed by immunofluorescence microscopy (IF). FLAG and DAPI signals are shown in Figure S5A. The magnified framed regions are depicted in the corresponding right panels. Hereafter, scale bar is 5 μm. (B) The percentage of cells from (A) with Aurora B localized to the monopolar spindles microtubules, n=2431. (C) HeLa cells were transfected with FLAG or FLAG-WT-UBASH3B and analyzed by IF. (D) Relative intensity of Cyclin B in cells depicted in (C), transfected with FLAG (blue bars) and FLAG-UBASH3B (red bars) n=131. The data are shown as the mean of three independent experiments ± standard error of the mean (S.E.M.). (E) Distribution of relative intensities of Cyclin B in individual cells quantified in (D). FLAG (blue lines) and FLAG-UBASH3B-expressing cells (red lines). (F) HeLa cells transfected with GFP or GFP-UBASH3B cDNAs were synchronized in prometaphase using STLC in the presence of MG132 and analyzed by IF. The magnified framed regions are shown in the corresponding right panels. GFP-UBASH3B and DAPI signals are shown in Figure S5D. (G) HeLa cells transfected with GFP or GFP-UBASH3B cDNAs were synchronized in prometaphase using STLC and analyzed by IF. The magnified framed regions of the Figure S5E are shown.

