
Fig. 10.
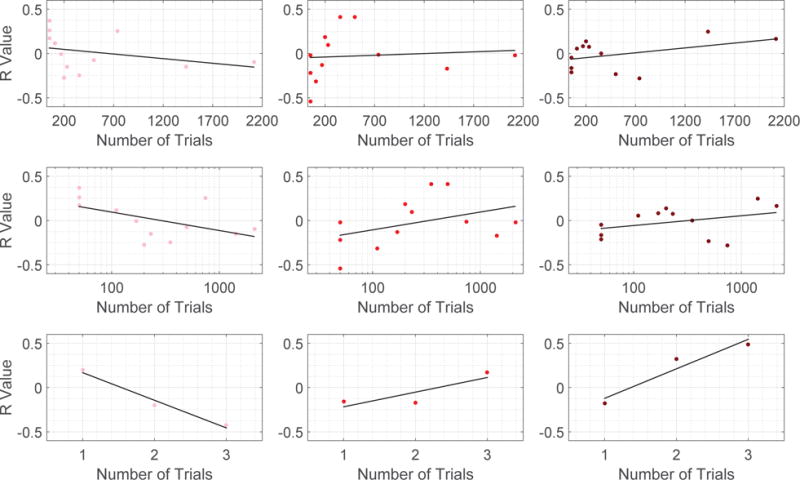
Scatter plots in which each point is for a specific training session (level of task familiarity), depicting the R value defined here as correlations between learning rate parameters and the norm of the decomposed signal of interest (Pink points in the Left: xL, Red points in the Middle: xM, and Maroon points in the Right: xH). Top row: 6 week experiment with number of trials described in linear scale. Middle row: 6 week experiment withe number of trials evaluated in logarithm scale. We examine 6 week experiment by ordering the number of trials in both linear and logarithm scales to alleviate the fact that number of trials are densely distributed towards small values. Bottom row: 3 day experiment in which the number of trials is represented by the 3 scanning sessions in the experiment.