
Fig. 12.
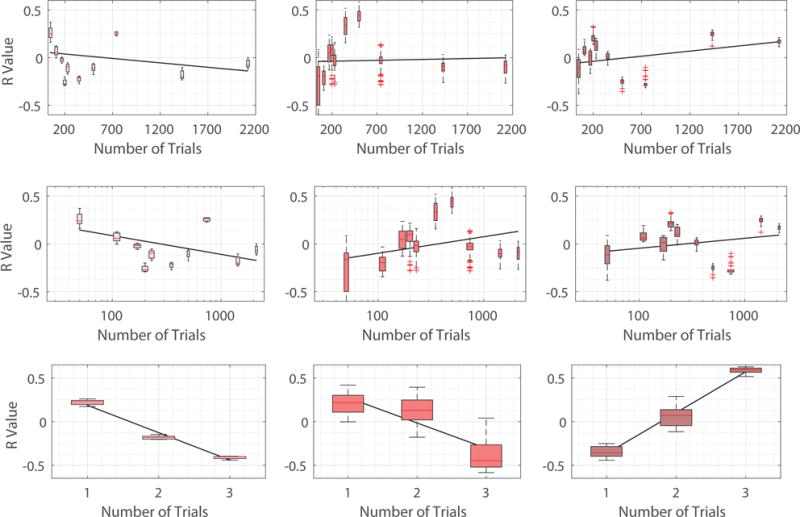
Robustness testing to show similar trends as observed in Fig. 10. Each box is for a specific training session (level of task familiarity), depicting the R values obtained from changing the frequency ranges of KL and KM between 32 and 42, inclusive. As such, the R value is defined here as correlations between learning rate parameters and the norm of the decomposed signal of interest for a specific frequency range. Each box contains R values for 121 different combinations of frequency ranges.