
Fig. 2.
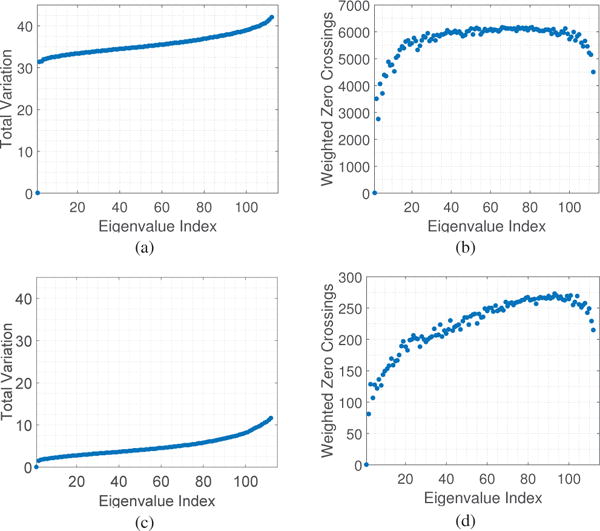
(a) Total variation TV(vk) and (b) weighted zero crossings ZC(vk) of the graph Laplacian eigenvectors for the brain networks averaged across participants in the 6 week training experiment. (c) and (d) present the values for the 3 day experiment. In both cases, the Laplacian eigenvectors associated with larger indexes vary more on the network and cross zero relatively more often, confirming the interpretation of the Laplacian eigenvalues as notions of frequencies. Besides, note that total variation increases relatively linearly with indexes.