
Fig. 3.
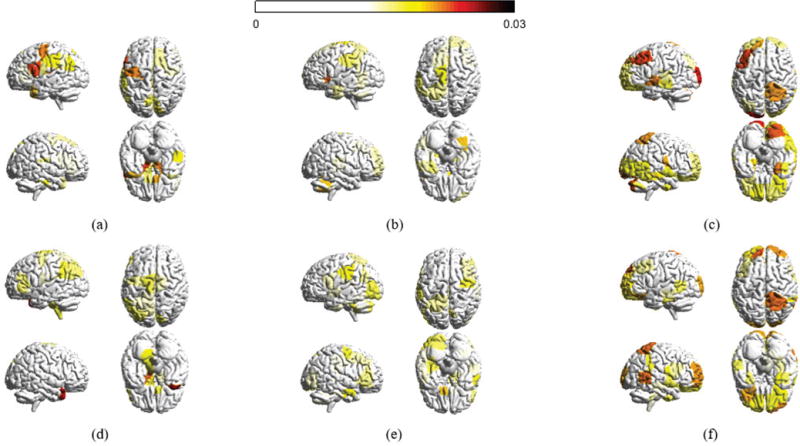
Absolute magnitude at each of the n cortical structures averaged across participants in the 6 week experiment and averaged across all frequency components in (a) the set of low graph frequencies , (b) the set of middle graph frequencies , and (c) the set of high graph frequencies (d)–(f) presents the average absolute magnitudes for the 3 day experiment. Only brain regions with absolute magnitudes higher than a fixed threshold (0.015) are colored. The magnitudes at different brain regions across the datasets are significantly similar in the low and high graph frequencies (correlation coefficients 0.5818 and 0.6616, respectively). The brain regions with high magnitude values significantly overlap with the visual and sensorimotor modules, in which more than 60% of values greater than the threshold belong to the visual and sensorimotor modules.