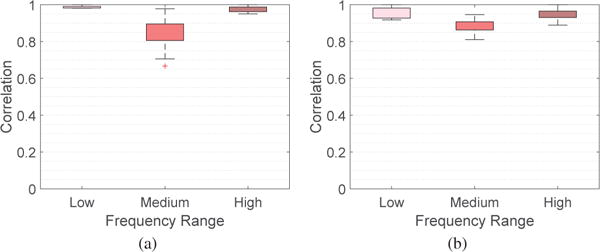
Fig. 4.

Box plots demonstrating the robustness of parameters chosen for different frequency ranges for the absolute magnitudes across brain regions for (a) 6 week and (b) 3 day experiments. Each box plot presents the correlation coefficients between the frequency range selected for this paper and all frequency ranges for KL and KM between 32 and 42, inclusive.
