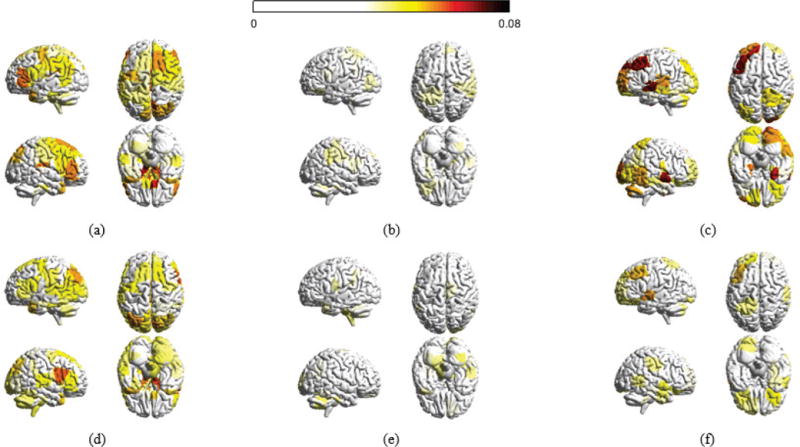
Fig. 6.

Distribution of decomposed signals for the 6 week experiment. (a) Absolute magnitudes for all brain regions with respect to xL – brain signals varing smoothly across the network – averaged across all sample points for each individual and across all participants at the first scan session of the 6 week dataset. (b) With respect to xM and (c) with respect to xH – signals rapidly fluctuating across the brain. (d), (e), and (f) are averaged xL, xM and xH at the last scan session of the 6 week dataset, respectively. Only regions with absolute magnitudes higher than a fixed threshold are colored.
