
Fig. 7.
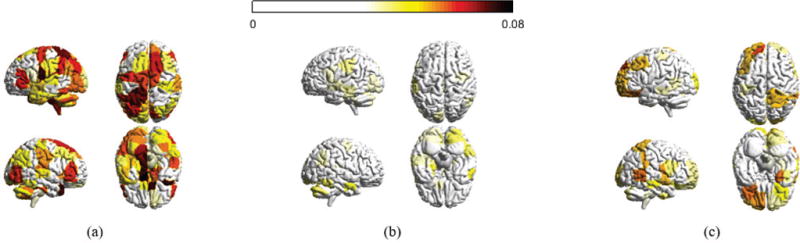
Distribution of decomposed signals for the 3 day experiment. (a), (b), and (c) are the absolute magnitudes for all brain regions with respect to xL, xM and xH, averaged across all sample points for each subject and across participants in the 3 day experiment, respectively. Regions with absolute value less than a threshold are not colored.