
Fig. 8.
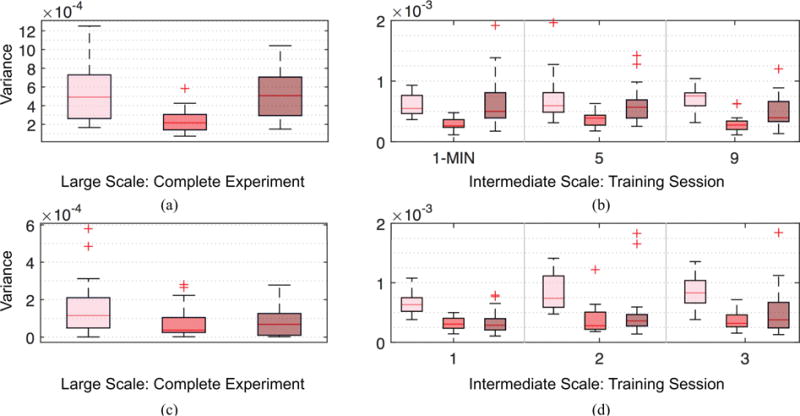
Temporal adaptations of spatial variations. Boxplots showing differences in temporal adaptabilities between brain activities with smooth (pink), moderate (red) and rapid (maroon) spatial variations, measured over the complete experiment for 6 week (a) and 3 day (c), and individual training sessions for 6 week (b) and 3 day (d) experiments. We measured the temporal adaptations using the variance of the averaged activities over the complete experiment or with individual training sessions. Compared to activities with moderate spatial variations, smooth (95% sessions pass t-test with p < 0.01) and rapid (65% sessions pass t-test with p < 0.005) spatial variations have significantly higher temporal adaptations.