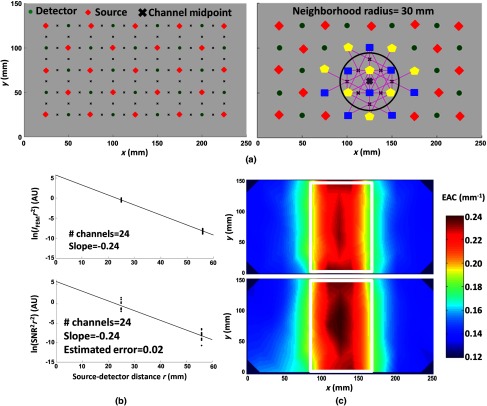
Fig. 8.
(a) Left image: Optode montage used for the simulated and real phantom data, together with the channel centers (midpoints). Right image: Optode montage with sources (yellow), detectors (blue), channels (represented as magenta lines), and the centers of each channel, reported as black x’s, involved in the computation of the EAC at the position indicated by the thick gray X, using a neighboring radius of 30 mm. (b) Top image: Logarithm of the intensity (multiplied by the term), computed using FEM simulations, as a function of interoptode distance, for the channels involved in the computation of EAC at the gray X point [Fig. 8(a), right image]. Bottom image: Logarithm of the (multiplied for the term), for real data at the same location. Although increased noise was found for in vivo data, the EAC estimates at the location of interest were identical (). The estimated standard error for the real measurement was [based on Eq. (4)]. (c) Top image: EAC maps obtained using light intensity in FEM simulated data. Bottom image: Topographic map of EAC obtained using the signal-to-shot noise ratio of recorded data. The white rectangle represents the original inhomogeneity position and shape (50 mm thick, 40 mm wide, and 100 mm long). Both images were obtained using a neighborhood sphere radius of 30 mm (average number of channels for each , ).

