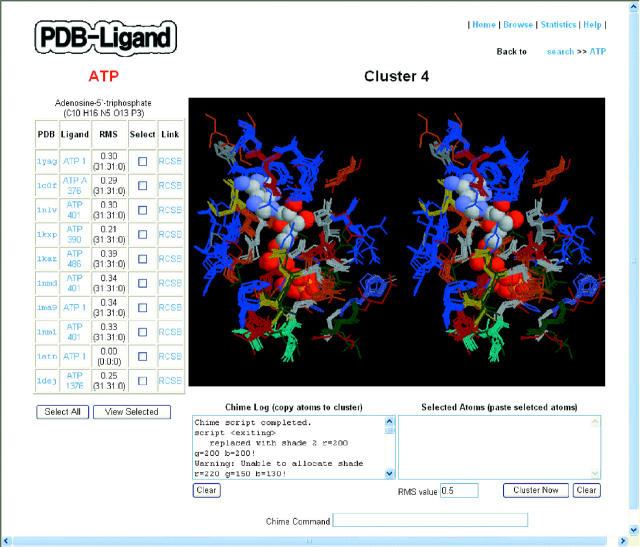
Figure 2.
A typical ATP-ligand cluster, obtained using default options. The 10 ATP-binding structures from 10 PDB entries are displayed in the ligand-information table on the left-hand side. The superimposed ATP-binding structures are shown in the chime-window in stereo view. ATP is shown in CPK model and the surrounding amino acids as connected line segments in different colors depending on the residue type. The chime utilities were used for the graphics rendering.

