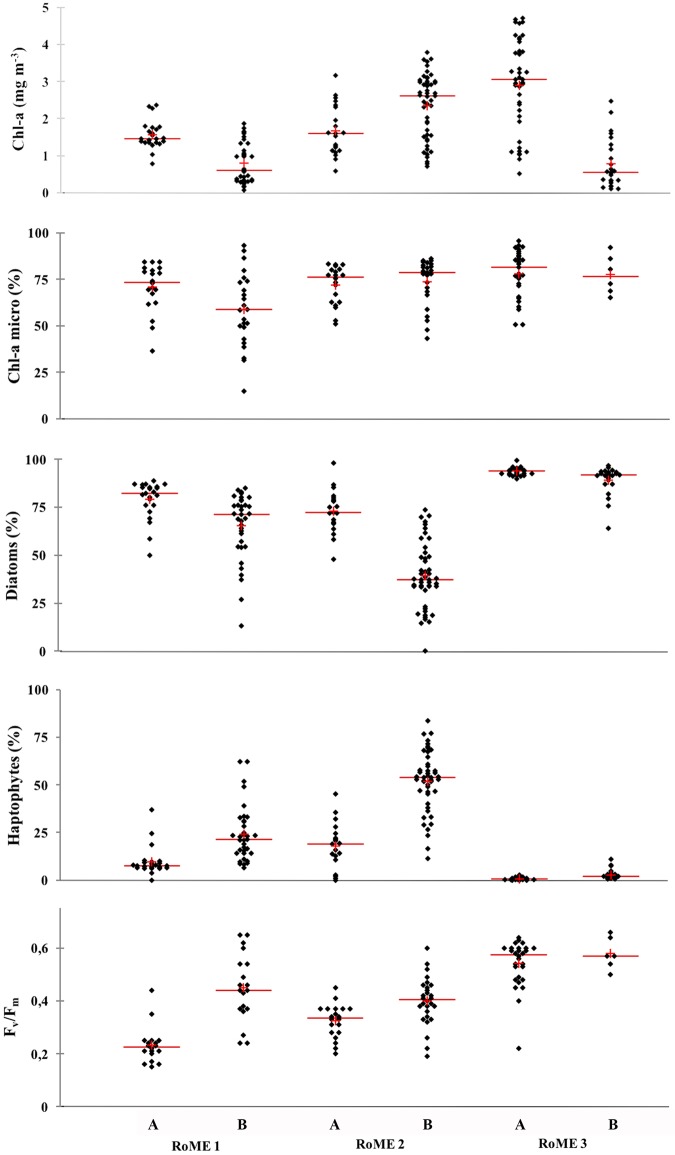
Fig 5. Biological features in the two investigated layers of each area.
Total biomass (mg Chl-a m-3), micro (>20 μm) fractions (%), diatoms (%), Haptophytes (%) and Fv/Fm [maximum quantum yield]. The red line is the median and red cross is the mean. Samples in the UML (A) and samples below the ULM (B).

