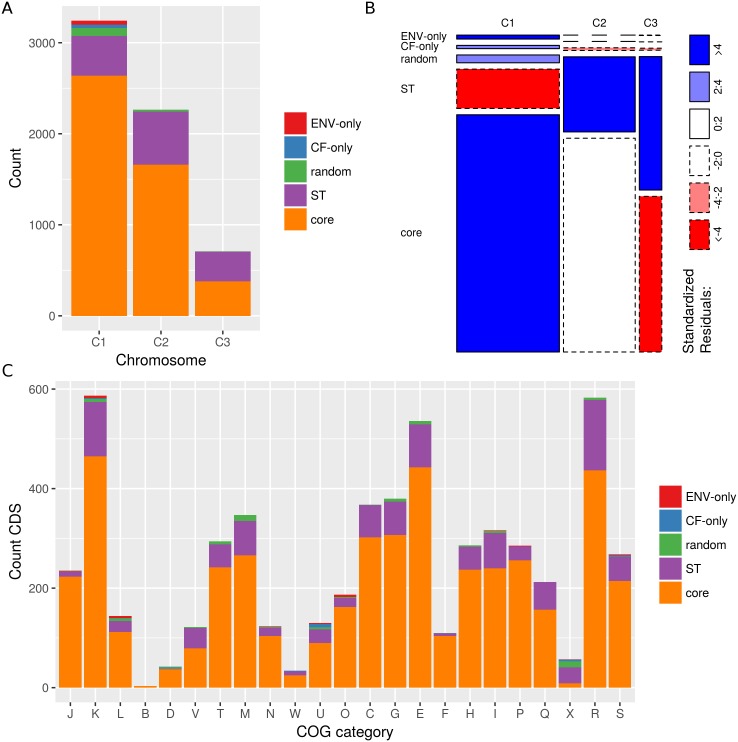
Fig 4. Ortholog specificity varies among chromosomes and COG categories.
Bar plots show the number of orthologs per specificity group for different chromosomes (X2(8) = 469.8, p<0.001) (a) and COG categories (X2(88) = 649.8, p<0.001) (c). Mosaic plots show the standardized residuals of the Pearson chi-square analysis on the number of orthologs per specificity group per chromosome (b). Solid and dashed boundaries represent positive and negative residuals, respectively. Rectangles are colored only if the standardized residual is significant at p<0.05 (outside ±1.96). COG categories: J, translation, ribosomal structure and biogenesis; K, transcription; L, replication, recombination and repair; B, chromatin structure and dynamics; D, cell cycle control, cell division, chromosome partitioning; V, defense mechanisms; T, signal transduction mechanisms; M, cell wall/membrane/envelope biogenesis; N, cell motility; W, extracellular structures; U, intracellular trafficking, secretion, and vesicular transport; O, posttranslational modification, protein turnover, chaperones; X, mobilome: prophages, transposons; C, energy production and conversion; G, carbohydrate transport and metabolism; E, amino acid transport and metabolism; F, nucleotide transport and metabolism; H, coenzyme transport and metabolism; I, lipid transport and metabolism; P, inorganic ion transport and metabolism; Q, secondary metabolites biosynthesis, transport and catabolism; R, general function prediction only; S, function unknown.

