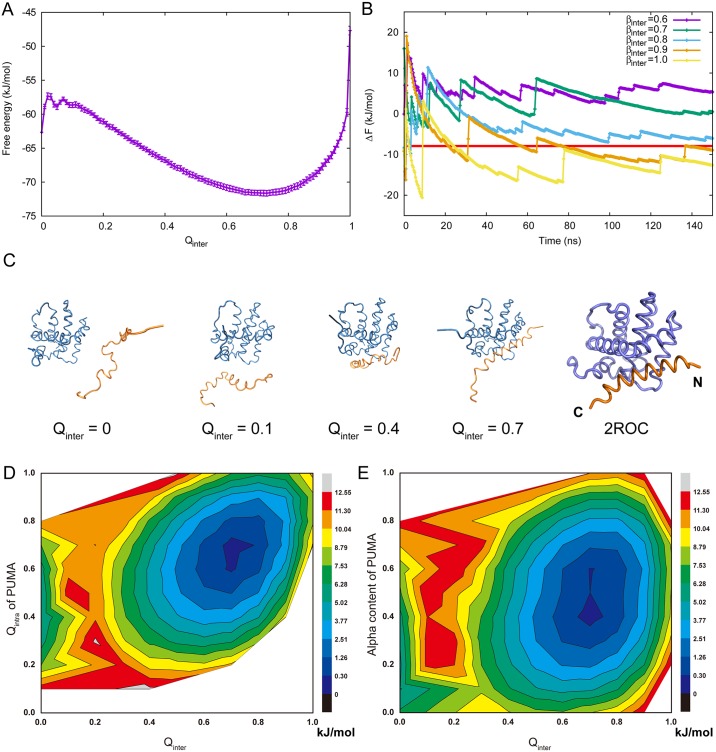
Fig 1. Parameter calibration and thermodynamic results.
(A) Free energy profiles of Mcl-1 and PUMA complex using fraction of intermolecular native contact between Mcl-1 and PUMA (Qinter) as well as the standard deviation. The standard deviation is calculated with the free energy data of the last 10 ns. (B) The convergence of binding free energy of Mcl-1 and PUMA with different β. The binding free energy was calculated by the energy difference between bound state (Qinter ∼ 0.7) and unbound state (Qinter = 0). (C) Representative frames throughout the binding process. The bound state in our simulations is consistent with the NMR structure 2ROC (right). Mcl-1 and PUMA is depicted with dark blue and orange tubes, respectively. (D) Free energy landscape of Mcl-1·PUMA complex on both fraction of intermolecular native contact (Qinter) and fraction of intramolecular native contact of PUMA (Qintra). (E) Free energy landscape of Mcl-1 and PUMA complex on both fraction of intermolecular native contact (Qinter) and helix content of PUMA. The helix content is calculated using torison angles. The z axis is the free energy (kJ/mol) calculated by the probability using WHAM [40] without the effect of bias potential.

