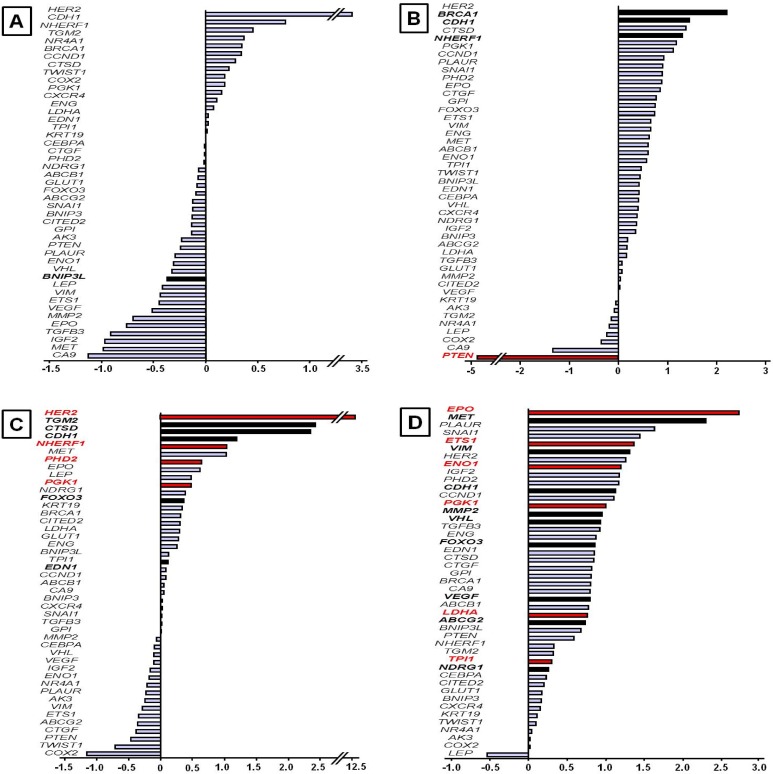
Fig 1. Hypoxia-related gene expression profiles according to clinicopathological data.
Gene expression was determined using quantitative real-time PCR as described in the Materials and Methods. The results are presented as the fold induction of relative quantification by classification in ascending order. A positive fold change of 1 indicated 2-fold up-regulation, and a negative fold change of -1 indicated 2-fold down-regulation. A comparative analysis was performed between (A) high tumor stage vs low tumor stage, (B) high mSBR grades vs low mSBR grades, (C) HER2+ status vs HER2- status, and (D) recurrent patients vs non-recurrent patients. Statistical analysis was performed between groups using Student’s t or Kruskal Wallis tests (red bar: p < 0.05; black bars: p < 0.10).

