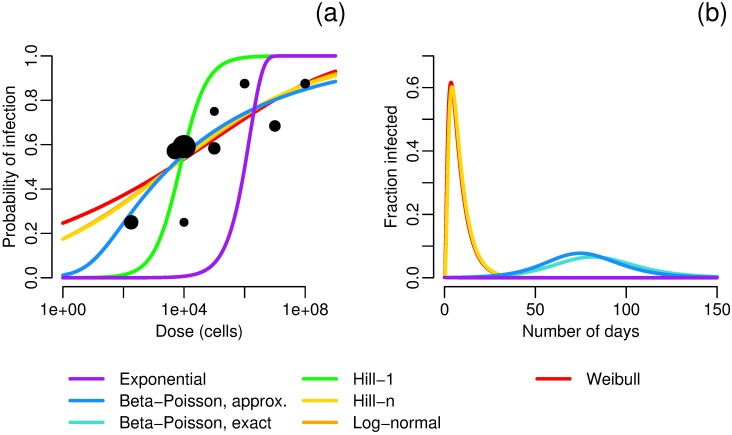
Fig 5. Shigella flexneri dose–response and dynamics.
a) Maximum-likelihood estimates of dose–response functions for Shigella flexneri. Data from [52, 53]; sizes of data points correspond to sample size. Best-fit parameters are given in Table 3. b) Modeled fraction of infected people under different Shigella flexneri dose–response relationships. Model parameters are N = 1000, S0 = 999, I0 = 1, W0 = 0, σ = 2/3 [54], γ = 1/6 [54], κ = 8 and ρ = 0.15 so that κρ = 1.2 L [47], V = 4E8, α = 4E7/V, μ = 5 [55, 56]. Model results using the Weibull, log-normal, and Hill-n functions lie nearly on top of each other, and those using the Hill-1 and exponential functions have no outbreak.

