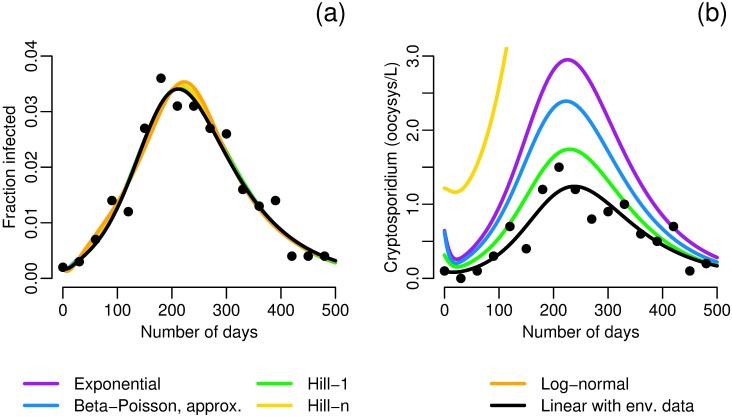
Fig 8. Simulated data and model fits for an outbreak of Cryptosporidium.
In both plots the colored lines are model fits for environmentally mediated infectious disease transmission models with dose–response relationships (Eq (3)), fit only to case data, that use the indicated dose–response function. The black line is the environmentally mediated infectious disease transmission model with linear infectivity (Eq (4)), fit to both case and environmental data. a) Case data and model fits. b) Environmental data and model fits (assuming κ = 8, and ρ = 0.15 [47] in order to estimate W in those models that do not observe the environmental data). The environmental estimate of the log-normal model, with an initial condition of 8.4 oocysts/L, is outside of the scale of the plot. Additional simulation details are given in S1 Appendix.

