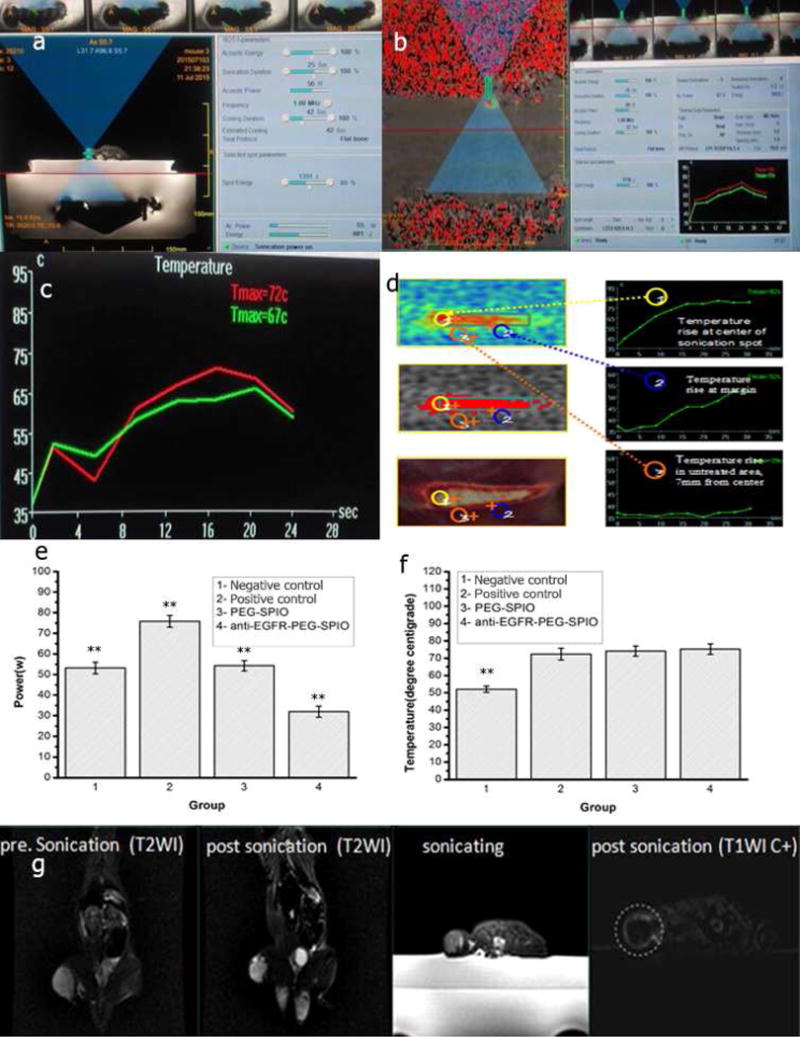
Fig. 6.

(a) Sonication process images. Treatment planning software on the MRgFUS workstation. In total, 5 sonications are needed to measure the circumference of this tumor. (b) Tissue temperature mapping during MRgFUS ablation. (c) Real-time temperature change in MRgFUS ablation monitored by MRI. (d) Schematic illustration of therapeutic temperature map in tumor center and margin. Sonication energy (e) and therapeutic peak temperature (f) of negative control (low power, 54 W), control (76 W), PEG-SPIO (54 W), and anti-EGFR-PEG-SPIO (32 W) at 4 h post-injection of SPIO nanoparticles. (g) Anti-EGFR-PEG-SPIO group: Coronal T2WI image signal intensity of tumor before treatment and after treatment. The coronal T2WI signal intensities of tumor increased significantly after therapy compared to before therapy (Fig. 6g). Enhanced axial T1WI-weighted images after injection of Gd-DTPA. Axial contrast-enhance T1WI subtraction images after injection of Gd-DTPA showed a small focal area of nonperfusion.
